While maintaining the 10 day's cash market data for "Inside day Narrow Range Seven Setup Screener" I came across this problem of huge file size (Microsoft Excel not responding) as well as getting unnecessary results (illiquid stock show narrow range quite often). Therefore, I decided to reduce my screening result to only top 600 stocks ( sorted by rupee volume i.e total trade value)
You can download the stocks data filter excel file, free from here
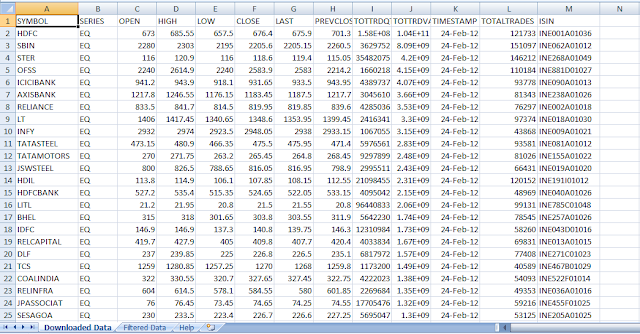
Screenshot of stocks data filter excel file below
How to use the file?
1) Copy the stock data in the first sheet "Downloaded Data", in this case I have downloaded stock bhavcopy data from NSE website.
2) Now in the second sheet "Filtered Data" I have used VLOOKUP function of Microsoft Excel to filter data, the stock list (600 stocks) for which I want the data, is added in the cells A700 to A1299. The filtered stock data is available between A2 to A601 cells with their respective price information.
That's all you need to do with this file. Before using the raw data from NSE bhavcopy, you can put that data in this file, it will filter out the excess data. You can change the stocks list as per your requirements, simply change the stock list (in the cells A700 to A1299) from 600 stocks to the stocks you want to track i.e the stocks in your portfolio or watchlist.
Hope you find it useful, please share if you like it.
You can download the stocks data filter excel file, free from here
Screenshot of stocks data filter excel file below

How to use the file?
1) Copy the stock data in the first sheet "Downloaded Data", in this case I have downloaded stock bhavcopy data from NSE website.
2) Now in the second sheet "Filtered Data" I have used VLOOKUP function of Microsoft Excel to filter data, the stock list (600 stocks) for which I want the data, is added in the cells A700 to A1299. The filtered stock data is available between A2 to A601 cells with their respective price information.
That's all you need to do with this file. Before using the raw data from NSE bhavcopy, you can put that data in this file, it will filter out the excess data. You can change the stocks list as per your requirements, simply change the stock list (in the cells A700 to A1299) from 600 stocks to the stocks you want to track i.e the stocks in your portfolio or watchlist.
Hope you find it useful, please share if you like it.
No comments:
Post a Comment