Whipsaws - A mood spoiler in trading
I was discussing about whipsaws with my friend and blaming automated trading for it.I feel that's not the right way to approach it.Check out the following three points and review your trades
1) Just check the kind of stocks or index you are trading ...are you trading Nifty?...or trying to find a trend in sideways trending stocks like NTPC, ITC, HUL..etc If yes then consider switching over to real estate and bank nifty for better trades or use a trading system meant for sideways market using oscillators.
2) Another issue could be a late entry..like entering around the end 3rd wave or during 4th wave as per Elliott wave principle.Now if you are not familiar with Elliot Wave, no problem..find out a way to screen a stock and enter after a sideways consolidation is significantly over...trend channels / Bollinger bands can also be used.
3) Another problem (most likely one) could be that you are placing your stop loss too close to CMP ( Current Market Price )...or trailing your stop loss too aggressively..If you are carrying positions for a couple of days consider placing a trailing stop at least 1 ATR away from recent highs...( is that too much for you?..then probably you should not be a swing or positional trader ...move to day trading )
Whipsaws in trading are part our business, they should not influence your day to day trading.Too much of thought about failed breakouts/whipsaws can result in loss in confidence and delay in decision making thus affecting profitability
Hope this helps
Cheers
Related Post
How do I calculate SAR
Inspirational Quotes - For Good And Bad Times
I will keep adding various quotes that I find motivational and inspirational from time to time,these will also feature in the "food for thought" section of the blog
I would request all readers to add their own favorites quotes,which they found had profound impact in their life or trading in the comments section
Cheers
********************************************
"... You can be free. You can live and work anywhere in the world. You can be independent from routine and not answer to anybody ..."
[Trading for a Living]
- Dr. Alexander Elder
********************************************
"Genius is one percent inspiration, ninety-nine percent perspiration."
– Thomas Alva Edison
********************************************
"The market can stay irrational longer than you can stay solvent."
-John Maynard Keynes
********************************************
“There is only one side to the stock market; and it is not the bull side or the bear side, but the right side.”
– Jesse Livermore
********************************************
"Chance favors the prepared mind."
- Louis Pasteur
********************************************
Disappointed by the Telecom Sector, how about the Technology Sector ?
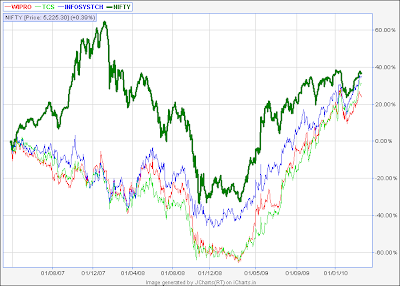
Yesterday I posted relative performance of the Telecom Sectors majors ,all the three companies (Bharti Airtel ,RCOM ,Idea) underperformed Nifty in all three time frames
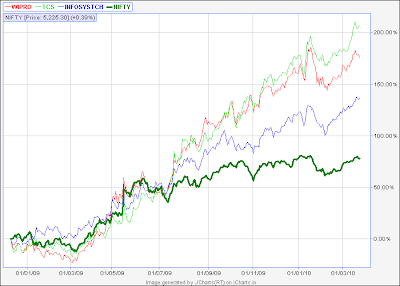
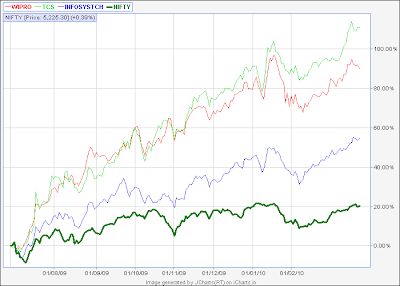
So to present a pleasant picture, I am uploading relative performance of Technology Sector majors (Infosys,TCS,Wipro).
Chart Since April 2007 ( before 2008 bear market set in )
Chart Since December 2008 ( before 2009 bull market started)
Chart Since July 2009 ( after election gap up )
Interesting charts (quite colorful as well!!),while technology sector was the under performer of previous bull market,this bull market is dominated by technology stocks.
That is a very important observation, it has been seen so many times in past that the leader of a bull market become laggards of the next bull market.So while this time Realty and Infrastructure Sectors are taking a breather,Technology and Auto Sectors have become trader's favourite
This should cheer up long term investors in the Technology Sector, value investors in meanwhile prepare to take profits....or is there more steam left?...Only time will tell...
Cheers
A picture is worth a thousand words - Telecom Stock Review
Chart Since December 2008 ( before 2009 bull market started)
Chart Since July 2009 ( after election gap up )
As we can see they are all under performing Nifty in all three time frames.That will make long term investor sad....at the same time it should alert a 'value investor' and an in depth company analysis will be required to make that long term bet...is all bad news factored in ?
Neglected Essential : Simple Money Management Rules For Online Stock Trading
The answer to the above question and for overall "good trading discipline" lies in sound money management practices. Money management is perhaps the most neglected idea in trading, psychology is another aspect often ignored by traders. Some people have written very complicated books on money management and related aspects using all sorts of mathematical ratios. But I am going to present it in a simple way (that's what this blog is all about,"the made easy" stuff right?). It will ensure that you keep your trading volumes in check, thus giving you enough liquidity and peace of mind in tense situations.
Advantages :
Disadvantages :
Online Stock Trading Made Easy - Lazy Trader...Crazy Returns
It will have the disadvantage of trailing stops which is you will always enter away from market tops and bottoms...thus giving back your accumulated profits...and also have advantage of trailing stops...will let profits run to maximum limit,and will not take you out when oscillators scream "OVERBOUGHT"
What ever system you choose it will favor certain market conditions and perform badly in other conditions
With that knowledge my task becomes easy...I am on look out for stock about to breakout in trend...or simply trade in trending stock and ignore sideways markets and stocks(FMCG and Pharma)
My businessman friend is looking for short cuts to trading ,can you help?
Excerpts from my reply are as follows
hi
First coming to your friend's problem..I think if he doesn't want to do some hard work or even get some basic information about stocks...he should not put money in any stocks.I truely understand his inclination towards stocks...that's because we are in a bull market and the returns that the market gave last year (100 % approximately)... will surely be more than the margin he makes in his business (even if its a successful business)...so he wants to try out his luck in stocks,he has some extra cash to burn and ready to lose money
He is in stage one of development of trader ....and will find one or the other way to BLOW his trading account soon...we all do that ...so only you can save him...If markets reaches all time highs...he will not even listen to your advice and jump in!!
What he can do is invest money in his own business...because he knows the pros and cons of it ...and he will be a master of his business....so why not put money in something he knows well...
If he still wants to put money in stocks...he should take up mutual funds...(I am strongly against mutual fund...because I can manage my money better than Mutual Funds...and investing in stocks is more convenient for me than Mutual Funds)
But mutual funds are tricky and timing is required in them too....so what he can do is put money when market corrects 10,30,50 percent from top....in three tranches...more money in percentage terms as market goes down...he can use same percentage (10,30.50.) of his total "extra" money...which he will not require for next 3 years...This is just a crude money management formula(I will come up with a better one in future)...basic thing is put money when price are low...buy low sell high kind of a strategy
So will the market correct 50 percent?...yes...and may be not for years(this is his basic set up to invest)...patience is required here...he need to have some quality at least to be successful...if hard work is not there... atlest patience should be...
http://new.valueresearchonline.com/default.asp
Check out this site...very good site for mutual funds' performance
See how badly they perform in bear markets and how well they do in bull markets check out 1, 2, 3 and 5 year performance
Why such kind of volatility in their performance?...they are supposed to be good money managers...well they are always invested type investors...so their performance goes up and down as per markets movement..do a comparative analysis between market's performance and mutual fund's performance...you will see some interesting facts..this is one of my favorites weekend activities!!
I dont know any good premium service provider,I never used them
If I was in his position I would invest in my own business...just as I do it now(trading is my business and I know it very well),if I have money I will put in stocks...not open a restaurant as I don't know anything about it (or gain information about it's operation,before I set up that business)
Important thing is don't use anybody's call...and if you do ...at lest don't sell your house and put money in anybody's calls...even if it's Warren Buffet's advice....because we all have different perceptions of money, our capital, markets and above all our expectations...that's why we fail in following calls give by anyone else ,no matter how talented that person may be .
Good luck.
Cheers
Triple Screen Trading System - Dr. Alexander Elder trading system
anuj
just thinking..u created so many excel programs.
what's ur view on elder's trading system..is it not good?
like to know ur views
best
sri
*****************************
My notes:
Dr. Alexander Elder trading system - http://www.elder.com/
Do you mean the triple screen trading system?
I think it is one of the best and logical way to trade.I feel it is similar to other systems or setups.like multiple time frames theory and what Ilango mentioned today in this blog 5th of 5th in Elliott wave...
What is 5th of 5th in Elliott wave? If you take a closer look you will see that, there is a 5th wave in progress and there are a smaller degree of a waves within that fith wave ,which is making 12345 wave pattern.
So the best place is to sell or buy is when markets are overbought or oversold in two time frames.I do this quite often.I check 15 min time frame and establish a bias (markets call table)and use Intraday (5 or 1 mins chart) to enter in direction of trend.
How do I do that?
Information that I have before the market opens (I know the direction of trend and I also know when it changes(SAR - Stop And Reverse )
Assuming we are in down trend(opposite in case of up trend).I try to establish a point where market will be overbought in 15 mins chart.Then I move to 5 minutes or 1 minutes to find overbought levels in that time frame.
This point is the place which gives me best risk to reward in terms of 15 minutes chart and my SAR (Stop And Reverse).So I enter shorts at that point
In simple words, look for a pullback (against the trend movement) in your trading time frame to get a good entry (better risk to reward ratio)
I hope it gives some new insights,for more read Dr Elder's book,Come into my trading room.I will discuss this in details with chart some other time
Good luck
Cheers
Related Post
Free Online Forex Futures Trading Strategy
Free Gold And Crude Oil Futures Tend Update
How do I calculate SAR
[FREE DOWNLOAD] Elliott Wave Calculator
I am uploading Elliott Wave Calculator Excel Spreadsheet. You can download it from here.
The calculator will help to broadly classify various waves associated with the Elliott Wave principle as per the Fibonacci ratios
Some of the commonly accepted ratios and rules have been taken into account while making the calculator.
Following assumptions related to price aspect are made while making the calculator.
1) You need to first establish Wave 1, based on that rest of the waves have been calculated .Once Wave 1 is identified, insert the values in grey cells under “FROM” and “TO” Cells
2) Wave 2 is 0.618 times Wave 1
3) Wave 3 is 1.618 times Wave 1
4) Wave 4 is 0.382 times Wave 3
5) Wave 5 is equal to Wave 1
6) Wave A is 0.382 times Wave 5
7) Wave B is 0.618 times Wave A
8) Wave C is equal to Wave A
Following assumptions related to time aspect are made while making the calculator.
1) Once Wave 1 is identified calculate the number of price bars between the start and end of the wave. Insert this in calculator (grey cell under the column “Time Bars”)
2) Wave 2 is 0.618 times Wave 1
3) Wave 3 is equal to the sum of time between Wave 1 and Wave 2
4) Wave 4 is 1.382 times Wave 2
5) Wave 5 is 1.382 times Wave 4
6) ABC waves is half in length to 12345 waves
7) Wave A and Wave C are of same time duration.
8) Wave B is 0.618 times Wave A
The above points are commonly accepted ratios in Elliott wave principle and thus are not absolute values
I feel if Elliott Wave price projection is used with oscillator divergence and trend channels, it can give quite reliable price projections. With the help of the calculator we can quickly form an opinion about the current trend in any time frame from 1 min to 1 month or more, in any stock or index
The calculator is still under development stage, price calculation have been fully developed, some aspects regarding time need to be modified if required
Lastly I would like to thank Ilango of "Just Nifty" for his valuable inputs in conceptualizing this calculator.For detailed information about Elliott wave ,please visit his blog.
Please post your feedback , suggestions and strategies about how this can be use in trading.
Good luck
Cheers
Apart from the above you may find these calculators useful while working with Elliott Wave principle:
Fibonacci Retracement calculator
Fibonacci Extension Calculator
Download - Elliott Wave Calculator Modifiable (Research Version)
Other Posts of Interest
Elliott wave pattern - Impulse (IM), Internal structure, Rules and Guidelines
Elliott wave pattern - Diagonal [Leading (LD) and Ending (ED)], Internal structure, Rules and Guidelines
Elliott wave pattern - Zigzag (ZZ), Double Zigzag (DZ), Triple Zigzag (TZ), Internal structure, Rules and Guidelines
Elliott wave pattern - Flat (FL), Double Sideways (D3), Triple Sideways (T3), Internal structure, Rules and Guidelines
Elliott wave pattern - Triangle [Contracting (CT) and Expanding (ET)], Internal structure, Rules and Guidelines
Free Online Forex Futures Trading Strategy
Free Gold And Crude Oil Futures Tend Update
Budget Day - Great way to test your intraday trading system's performance
First of all Happy Holi to everyone,hope every body enjoy playing with "other colors" apart from our daily favorites, green and red!!!
Friday was the budget day and as always it was a volatile day,reasons are quite simple, a lot of economic and industry specific news is released in very short period of time while the market are open.
I am attaching three charts :
IFCI - went up all day
ITC - went down all day
DLF - went up and lost ground at much faster pace
I feel these were nice intraday movements and are quite good to test your intraday system.While the news flow is heavy on budget day,tracking, analyzing and reaction to every piece of news is impossible.Price movement is our most reliable tool in this case ,as always.I would like you to test your intraday trading system base on these stock price movement.It will tell you whether your system is more of a leading or lagging in nature.It will also give you important insights into your own psychology of how you tend manage changing market conditions.Try to imagine how you would have traded in these three stock that day.As history repeats itself(one of the basic principles on which technical analysis is based) it will make you better prepared the next time you witness such a volatile day with divergent stock price movement
Cheers.
IFCI
ITC

DLF
Popular Posts
How To Become A Stock Trader - 6 Stages Of Development As A Share Market Trader, Trading For A Living – A Practical idea?,How to use the market calls table, Simple Money Management Rules For Online Stock Trading, Buy Only and Sell Only Watch List, How do I calculate Stop and Reverse (SAR) Level ?, How to avoid whipsaws in trading, Inspirational Quotes - For Good And Bad Times, Elliott wave pattern - Impulse (IM), Internal structure, Rules and Guidelines, Diagonal [Leading (LD) and Ending (ED)],Zigzag (ZZ), Double Zigzag (DZ), Triple Zigzag (TZ), Flat (FL), Double Sideways (D3), Triple Sideways (T3), Triangle [Contracting (CT) and Expanding (ET)], Download - Elliott Wave Calculator,Free online Black Scholes option value and option greeks calculator,Free Download - Position Sizing Calculator For Stocks, Commodity And Forex Trading Using Microsoft Excel, Stock screener based on comparative relative strength indicator method, How to filter stock's information, to get the data for your portfolio scrips, Calculating Compound Annual Growth Rate (CAGR) for investment, Stock Scan setup using Narrow Range Seven (NR7) Strategy, Average True Range (ATR) Indicator Calculator Excel Sheet, Pivot Point, Support and Resistance Calculator for Intraday Trading, Relative Strength Index (RSI), Fibonacci Extension, Fibonacci Retracement, Compounding Calculator, Simple and Exponential moving average in Excel, DJIA Today [FREE DOW FUTURES LIVE CHART] Price Rate


